Educators and parents alike are turning to printable 100‑number charts as a low‑cost way to boost numeracy, but the one‑size‑fits‑all format often falls short of classroom realities. This guide unpacks practical ways to tailor those charts—whether you need a visual cue for shy learners, a color‑coded system for differentiated instruction, or a design that syncs with a homeschooling curriculum—so the printable becomes a dynamic teaching tool rather than just a wall decoration.
Identify the Learning Gap Before You Print
The first hurdle is recognizing why a standard chart isn’t working. A common symptom is that students stop referring to the chart after the initial novelty wears off. Conduct a quick observation: note which numbers students avoid, whether they struggle with counting sequences, or if visual clutter overwhelms them. Pinpointing the exact gap—whether it’s a lack of pattern recognition, difficulty with skip counting, or insufficient reference for problem‑solving—gives you a clear target for customization.
Color‑Coding for Cognitive Hooks
Research shows that color aids memory retention, especially for early learners. Assign a hue to each ten‑block (0‑9, 10‑19, etc.) and use contrasting shades for multiples of five. For example, a light teal for 0‑9, a pastel orange for 10‑19, and a bold navy for the “5, 10, 15…” cells. The visual break helps students locate key numbers faster and reinforces the concept of grouping. When printing, select a palette that complies with your school’s accessibility standards—high contrast and color‑blind friendly options are readily available in free design tools.
Integrate Curriculum Milestones
Rather than a static grid, embed milestones directly onto the chart. Mark the row where students first master addition facts, or highlight the column that aligns with a upcoming unit on multiplication. A simple “★” or a sticker placeholder can turn the chart into a progress tracker. This approach not only personalizes the resource but also gives teachers a quick reference for differentiated instruction, allowing them to pull targeted practice from the chart itself.
Size and Layout Adjustments for Different Spaces
Classrooms vary from compact preschool corners to sprawling middle‑school walls. Resize the chart to fit the specific surface area: a 22‑inch wide version works on standard bulletin boards, while an A4 landscape sheet prints neatly on a desktop printer. For mobile environments—think math labs on wheels—consider a foldable accordion format that can be tucked into a storage bin and unfolded for instant use.
Add Interactive Elements with Minimal Ink
Embedding interactive prompts doesn’t require a full redesign. Include a small “What’s Next?” box beside each ten‑block that asks students to write the next number in the sequence or draw a quick picture representing that value. Because the prompt occupies only a few square inches, you preserve the chart’s readability while encouraging active engagement. When students complete the prompts, they can use a dry‑erase marker to erase and start anew, extending the chart’s lifespan.
Leverage Free Digital Platforms for Custom Prints
Tools like Canva, Google Slides, and the open‑source Inkscape offer templates that let you swap fonts, adjust spacing, and insert icons without any design experience. Import a basic 100‑number grid, apply your chosen color scheme, and overlay the curriculum milestones. Most platforms also allow you to store the file in a cloud folder, enabling quick re‑prints for rotating classrooms or seasonal themes (e.g., holiday‑themed numbers).
Test, Tweak, and Share the Results
After printing, place the chart in a high‑traffic area and monitor usage for a week. Gather informal feedback: “Do the colors help you find numbers faster?” or “Did the milestone markers make it easier to see what we’re learning?” Small adjustments—like swapping a hard‑to‑read font for a clearer sans serif—can dramatically improve effectiveness. Finally, share your customized version with fellow educators through a school’s shared drive or a teacher‑focused community; collaborative refinement often yields the most robust resources.
Bottom Line: Personalization Turns a Printout Into a Pedagogical Ally
Customizing 100‑number chart printables is less about aesthetic flair and more about aligning the visual tool with concrete learning objectives. By diagnosing the precise need, applying strategic color‑coding, embedding curriculum checkpoints, and iterating based on real‑world use, teachers can transform a simple wall chart into a versatile, student‑centered asset that supports both foundational numeracy and ongoing skill development.
Jonathan Hickman And Bryan Hitch Team Up For New Ultimate Marvel Comic
:max_bytes(150000):strip_icc()/Ultimate-Invasion-022123-04-90bd12d1babc465188d46affac58053a.jpg)
Jonathan Hickman and Bryan Hitch team up for new Ultimate Marvel comic
Ultimate Frisbee Disc
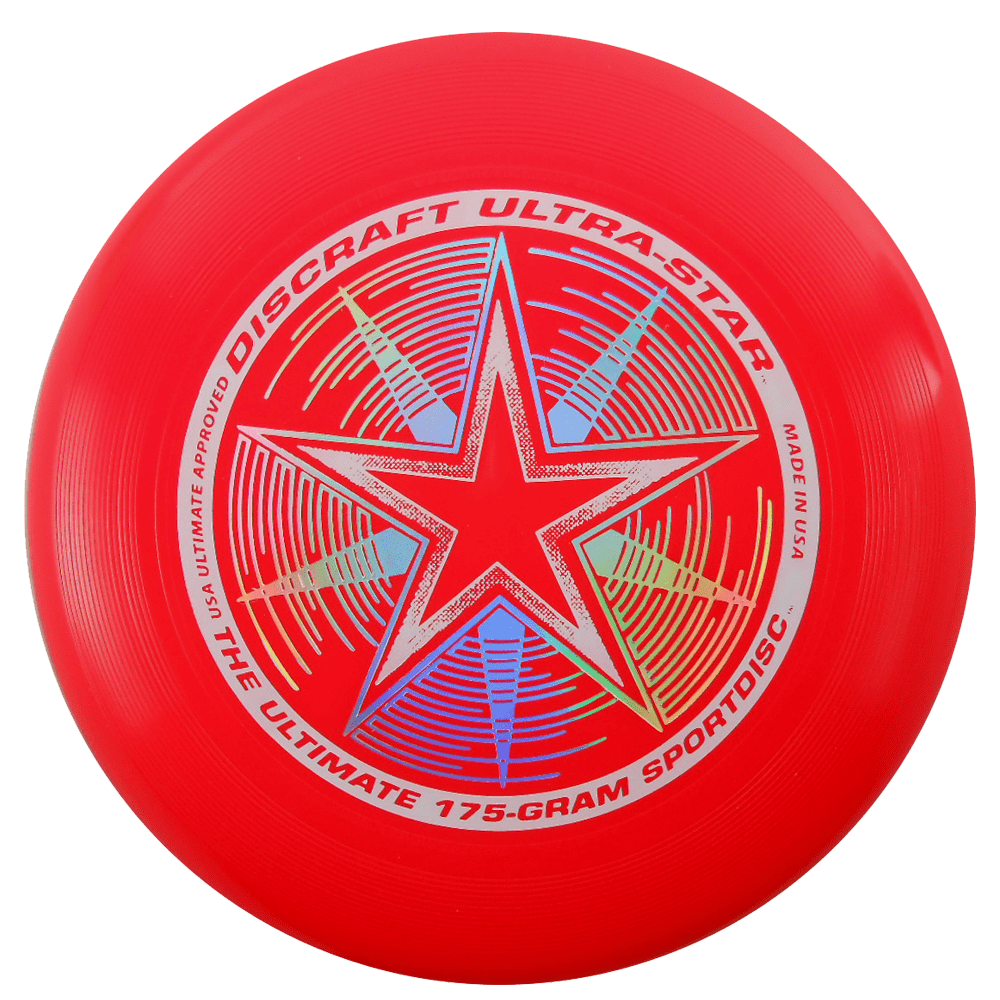
Ultimate Frisbee Disc
HUAWEI WATCH Ultimate 2 - HUAWEI Hrvatska

HUAWEI WATCH Ultimate 2 - HUAWEI Hrvatska
Ultimate Frisbee Disc
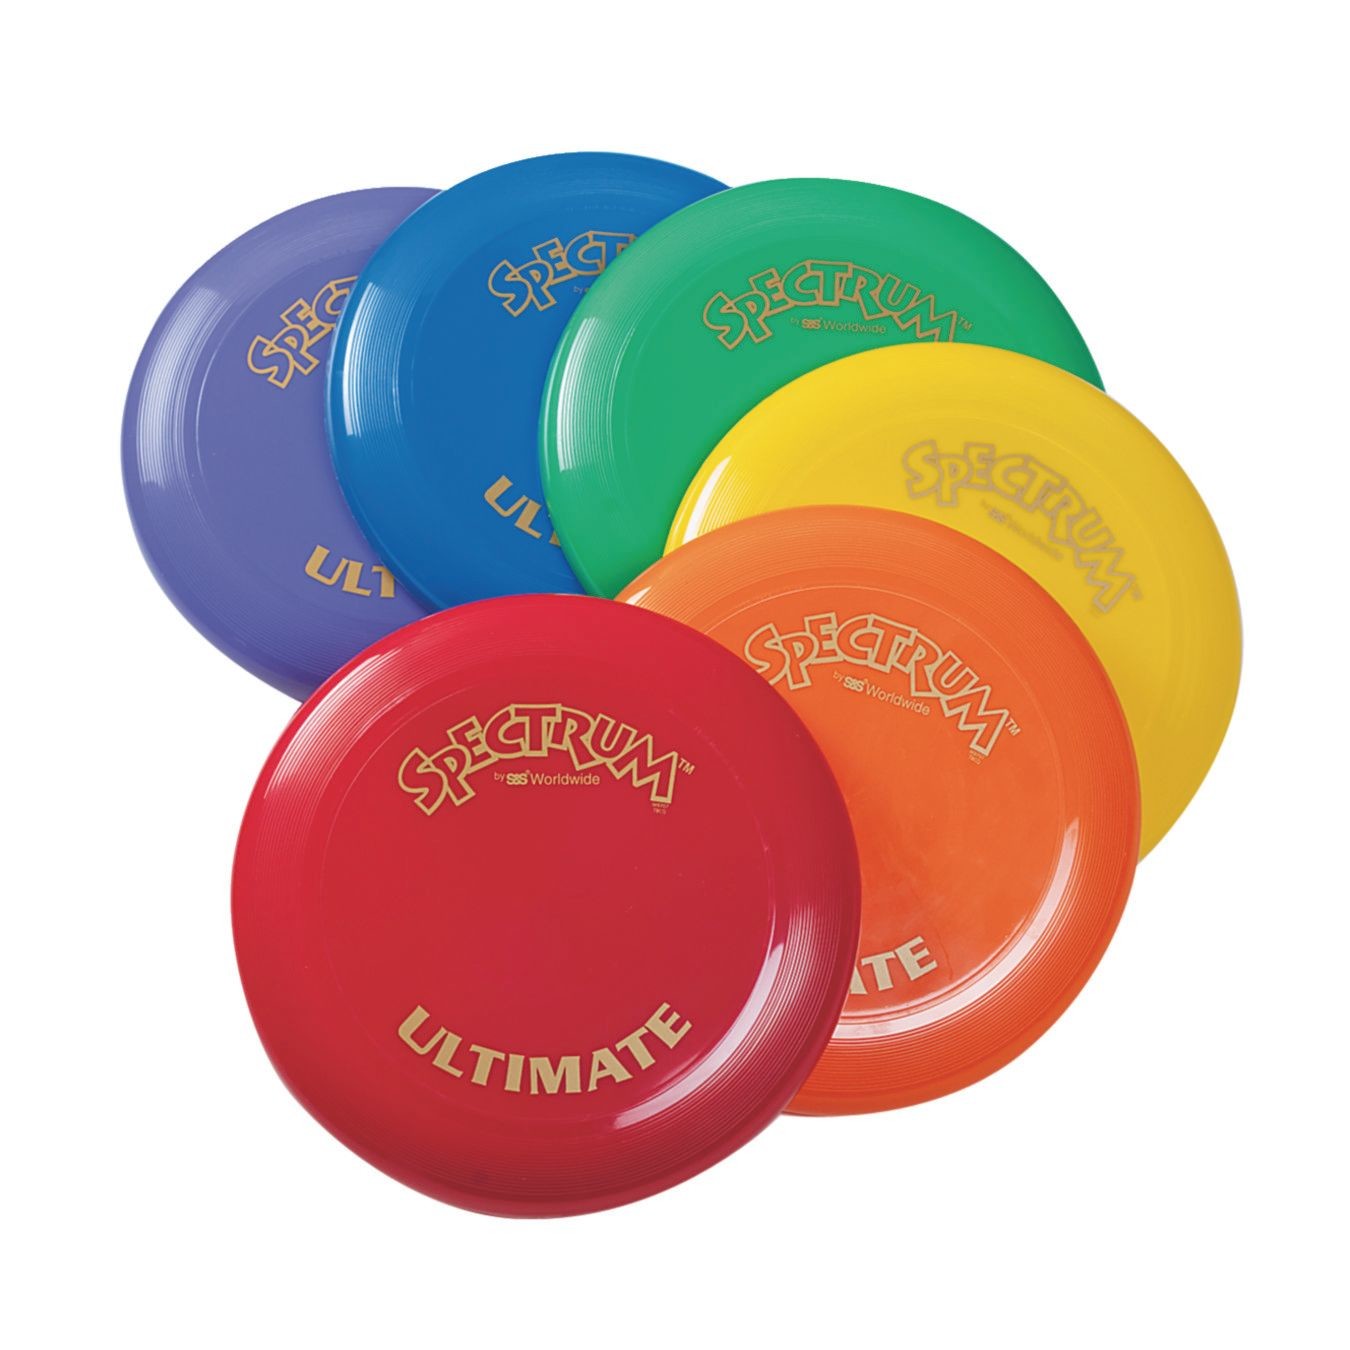
Ultimate Frisbee Disc
Ultimate UltraStar Disc – Over The Top Disc Golf

Ultimate UltraStar Disc – Over The Top Disc Golf
